Validation of video analysis
Why Video analysis?
The current mechanism of sleep analysis in Drosophila relies completely on fly activity, yet the standard system based on IR beam breaking can provide only a very limited measure of a fly movements. For instance, if the animal moves away from the infrared beam no movement can be detected. A very detailed comparison of video analysis vs. IR based analysis has been published by Zimmerman and colleagues and we refer to that study for a complete description of the general advantages of video recording over infrared.
The goal of analysis presented in this page is not to give details about the actual sleep pattern of flies, as that has already been done extensively in the above mentioned study, but to offer evidence that pySolo video plugin system is reliable in detecting the actual activity of the flies despite the inexpensive setup.
pySolo video: reliability of the system.
To test the reliability of the system, we recorded activity of flies that were at the same time housed in a TriKinetics Infrared monitor (DAMS). This allows for real time comparison of the two recording methods. The IR system recorded the number of beam crossings in 1-min bins. The video system recorded the position of the flies at 5-sec intervals. Activity was then computed in two different ways:
- regular infrared (IR) activity through the DAMS TriKinetics monitor, based on number of IR beam crossings per minute.
- video activity, emulating a virtual TriKinetics monitor. With this system we emulate a virtual beam that divides the recording area in two halves, approximately in the position where the real beam does. Given that the position of the fly at every moment is known, the software can estimate activity as number of times the flies cross the virtual beam.
If our acquisition system is working properly we should expect a good match between the results obtained using the IR monitor and the ones calculated using the virtual TriKinetics. This is indeed what we observed, as shown in Figure 1.

Figure1. Comparison between the infrared monitor system and the video system. a) Snapshot showing the setup. Seven vials were placed in the TriKinetics monitor and simultaneously video recorded. The movement of every fly was recorded in its own region of interest (white rectangle surrounding the glass vial). For the virtual IR system, a virtual beam was drawn in the middle of the recording area (dashed line). Position of the fly (white circled) was recorded every 5 seconds and compared to the position of the beam. Crosses from north to south of the beam were counted as activity quanta. b) Average sleep for all seven flies measured using the IR data (gray) or the virtual monitor system (blue). c) Same as in B, but showing only data for 1 fly.
The IR system recorded an average sleep amount for seven flies of 918.14 ± 145.54 (in min, mean ± S.D.). The virtual TriKinetics system recorded an average of 901.29 ± 240.10. The slight difference between the two measurements is to be attributed mainly to the difference in size and position between the real beam and the virtual beam, and to a smaller extent to some noise introduced by the IR light sources in the TriKinetics monitor (see figure1A). Daily activity and sleep as measured by the two systems is shown in figure 1B, while figure 1C shows the comparison between the two measurements using a single fly.
Downloads:
Compiled data (184kb – zip). This archive contains the raw coordinates, the masks used for the analysis and the compiled data in the pySolo Format.
Images (60Mb – zip). This archive contains images at 1 minute interval to be used for reproducing the data. Images have resolution of 960×720 and quality 70.
Figure1 (PDF)
pySolo video: quality of the input files.
Having validated the efficacy of the video recording, we next asked how important it was to collect and record high quality images. For offline analysis images are saved on the disk and the user can proceed with movement detection on a second moment. Images are normally saved as jpg files, with a quality (compression) factor of 70%.
To compare different quality settings 22 wild type flies were recorded for 24 hours in a high quality format (960×720 without compression). The same images were then processed and saved again changing several quality settings, combining resolution and compression (see table 1). Activity and sleep were then measured for each of the above conditions.
An empty area (channel 23) and 5 vials with dead flies were also used as control for image artifact. The result of the comparison is shown in table 1 and figure 2.
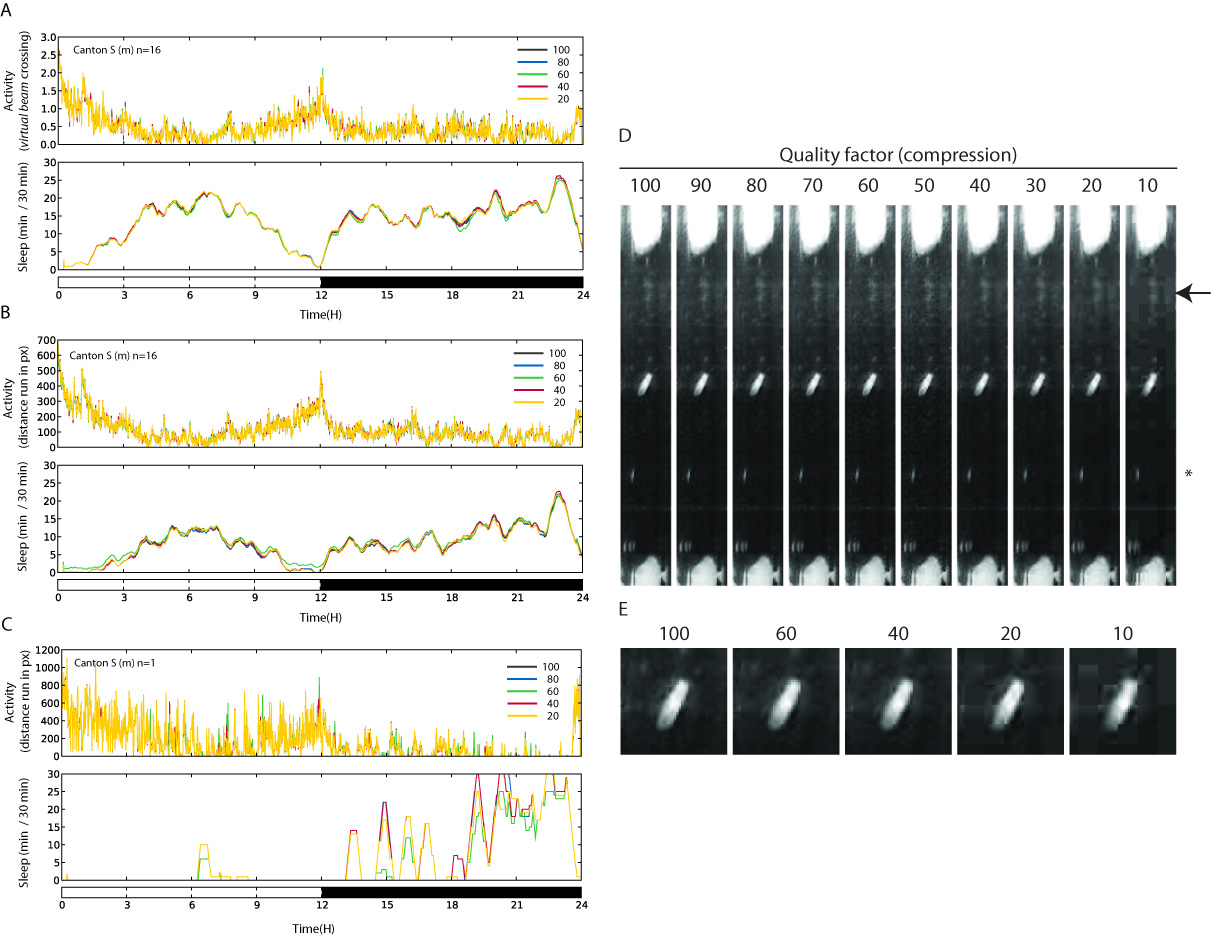
Figure2. Comparison between different quality settings. a) Average sleep of all flies calculated using the virtual Trikinetics system, showing the daily activity (upper panel) and sleep (lower panel) for different compression settings. b) As in A, but sleep and activity are calculated using the actual flies movements (pixel per minute). c) Sleep and activity of 1 single fly shown as in B. D-E) Magnified images of several compression settings.
| distance based | virtual TriKinetics | ||||||||||
| Resolution | Quality | File size (kb) | 1Day (5sec) | Sleep | (%) | Std. Dev. | Sleep | (%) | Std. Dev. | ||
| 960×720 | 100 | 253.6 | 4.4 Gb | 465 | 0.0 | 365 | 648 | 0.0 | 274 | ||
| 960×720 | 90 | 113.6 | 1.96 Gb | 465 | 0.0 | 365 | 648 | 0.0 | 274 | ||
| 960×720 | 80 | 85.2 | 1.47 Gb | 475 | 2.3 | 370 | 655 | 1.0 | 279 | ||
| 960×720 | 70 | 75.9 | 1.31 Gb | 458 | -1.4 | 362 | 648 | -0.1 | 275 | ||
| 960×720 | 60 | 70.4 | 1.21 Gb | 459 | -1.2 | 389 | 694 | 7.1 | 349 | ||
| 960×720 | 50 | 67.2 | 1.16 Gb | 398 | -14.3 | 418 | 652 | 0.6 | 345 | ||
| 960×720 | 40 | 43.4 | 750 Mb | 435 | -6.4 | 310 | 660 | 1.9 | 273 | ||
| 960×720 | 30 | 38.1 | 658 Mb | 480 | 3.3 | 370 | 662 | 2.1 | 277 | ||
| 960×720 | 20 | 29.49 | 509 Mb | 480 | 3.3 | 370 | 664 | 2.5 | 277 | ||
| 960×720 | 10 | 21.9 | 378 Mb | 463 | -0.4 | 393 | 666 | 2.8 | 311 | ||
| 640×480 | 100 | 167 | 2.88 Gb | 465 | 0.2 | 231 | 660 | 1.8 | 278 | ||
| 640×480 | 90 | 68.9 | 1.19 Gb | 472 | 1.6 | 229 | 664 | 2.4 | 274 | ||
| 640×480 | 80 | 46.7 | 800 Mb | 467 | 0.5 | 230 | 662 | 2.2 | 278 | ||
| 640×480 | 70 | 37.6 | 650 Mb | 474 | 2.0 | 230 | 664 | 2.5 | 275 | ||
| 640×480 | 60 | 31.5 | 544 Mb | 474 | 2.0 | 232 | 666 | 2.8 | 276 | ||
Table1. Comparison of different quality settings. The “1 Day” column indicates the amount of space taken by 17280 frames, equivalent to one snapshot every 5 seconds. Sleep and SD are expressed in minutes (rounded to the closest integer). Percentage difference refers to 960×720 at quality 100.
In our conditions, a compression factor of 70%-90% probably offers the best trade-in between space occupied on disk and quality of the recording.
On a related note, it is worth noticing that the results obtained with this analysis indicate that the TriKinetics IR system should overestimate consistently the actual amount of sleep. This is expected and it is in full accordance with what published by Zimmerman and colleagues ( Sleep. 2008 Nov 1;31(11):1587-98). In particular, Zimmerman et al showed that, for CantonS males, the TriKinetics IR system overestimates total sleep by 40.5%, whereas we find an overestimation of +39.56%. According to Zimmerman et al, the greatest discrepancy between the TriKinetics IR system and the video analysis is in daily sleep (overestimation = +80.3% at day, +22.9% at night). Our analysis also confirms these results (overestimation +50% at day, +33% at night).
Downloads:
Picture samples (11mb – zip). This archive contains 10 pictures for each of the 20 quality settings and the python script to generate more images.
Compiled data – 960×720 (4.5mb – zip). This archive contains the the mask used for the analysis, the raw coordinates files and the pySolo compiled files.
Compiled data – 640×480 (2mb – zip). This archive contains the the mask used for the analysis, the raw coordinates files and the pySolo compiled files.
Figure 2 (PDF) and Table1 (XLS)
pySolo video: frequency of image acquisition
Default acquisition is done at a frequency of one image every 5 seconds. Lower sampling frequency will reduce the load of the files on disk but will also result in loss of information as flies can frequently make small in loco movements that only a relatively frequent sampling rate will be able to identify. See figure 3 for a comparison between three different sampling rates.

Figure 3. Comparison between activity and sleep of all flies calculated using different sampling rates: one frame every 5 seconds (gray), one frame every 30 seconds (blue) and one frame every minute (green).
Downloads:
Compiled data (700kb – zip). This archive contains the the mask used for the analysis, the raw coordinates files and the pySolo compiled files.
Figure 3 (PDF)